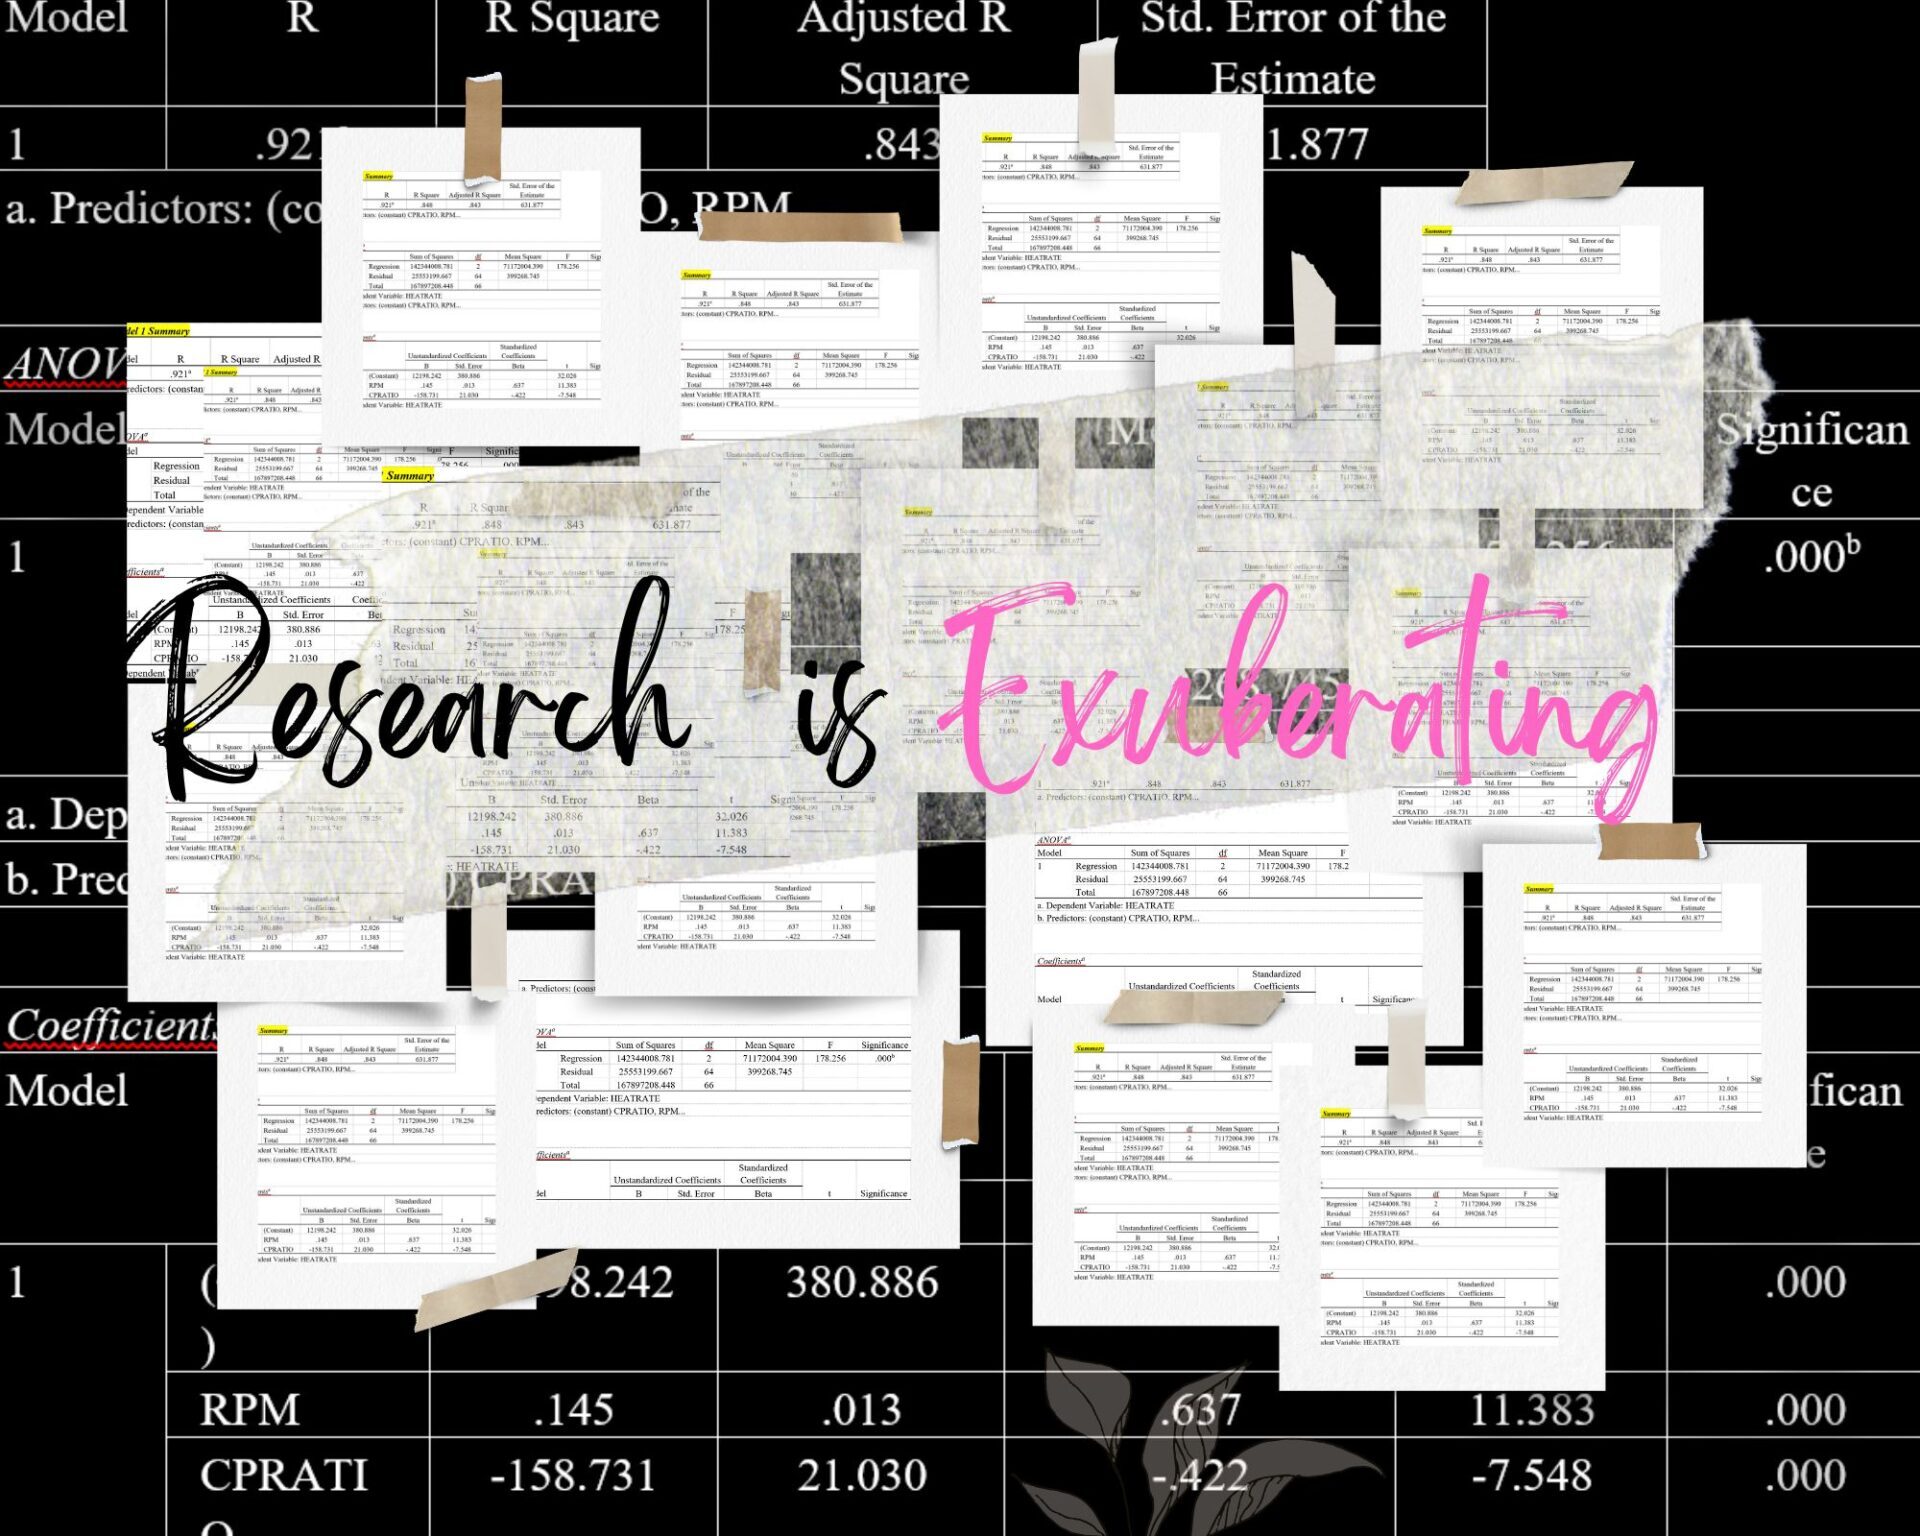
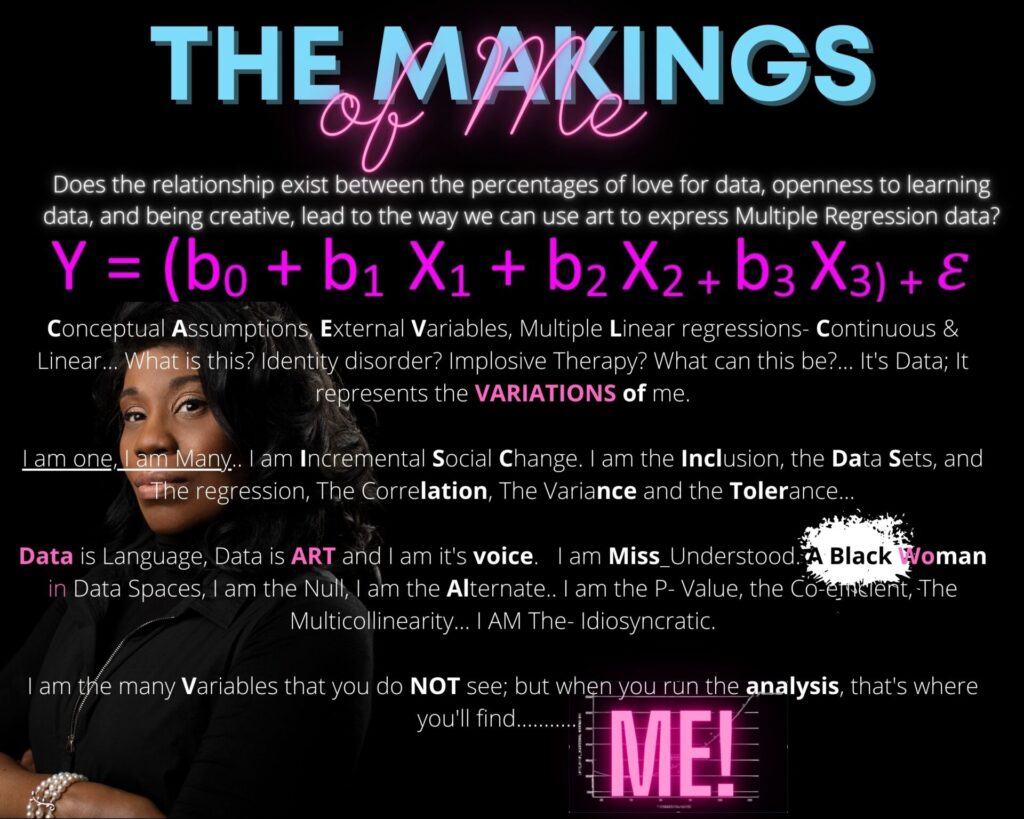
I am inspired to apply my passion for quantitative data and how a research problem can be visually characterized. I will present this further as visual art – and perhaps how I see data. I enjoy connecting quantitative data through a meaningful process and how data – yes, quantitatively, provide meaning to me. Data, to me, is an art, and I am always in awe of the many multifaceted ways it can be presented.
We know there are some noticeable differences between quant and qual. Data selection in qualitative summarizes organizing themes of existing content, to name a few. At the same time, quant requires you to dig through sometimes exhaustive amounts of data, often collected through statistical programs to discover the story.
Now, I don’t want to get too much into statistics but rather provide some analysis of how I see this visually and connect this to a phenomenon. Most importantly, how I am connected to this–data. Beyond data collection, I can think about how I best can draw extensions (Pink, 2011) and the experiences of the population I am measuring. What can the numbers and outcome variables tell me qualitatively as the researcher?
Let’s say I ran a frequency distribution. When running a frequency distribution, I seek the probability distribution that may visually represent more than one peak, or “mode.” In statistical terms, this is called unimodal, the distribution of two peaks is bimodal, and the distribution with two peaks is more multimodal. The multimodal distribution often indicates that the study comes from several subpopulations. But, I am also using multimodalities to represent data – qualitatively. What do the variations in the bar graph tell me? Up and down they go! They are ambiguous but certain. Normalcy is represented in view, BUT there is more to the world beyond this point.
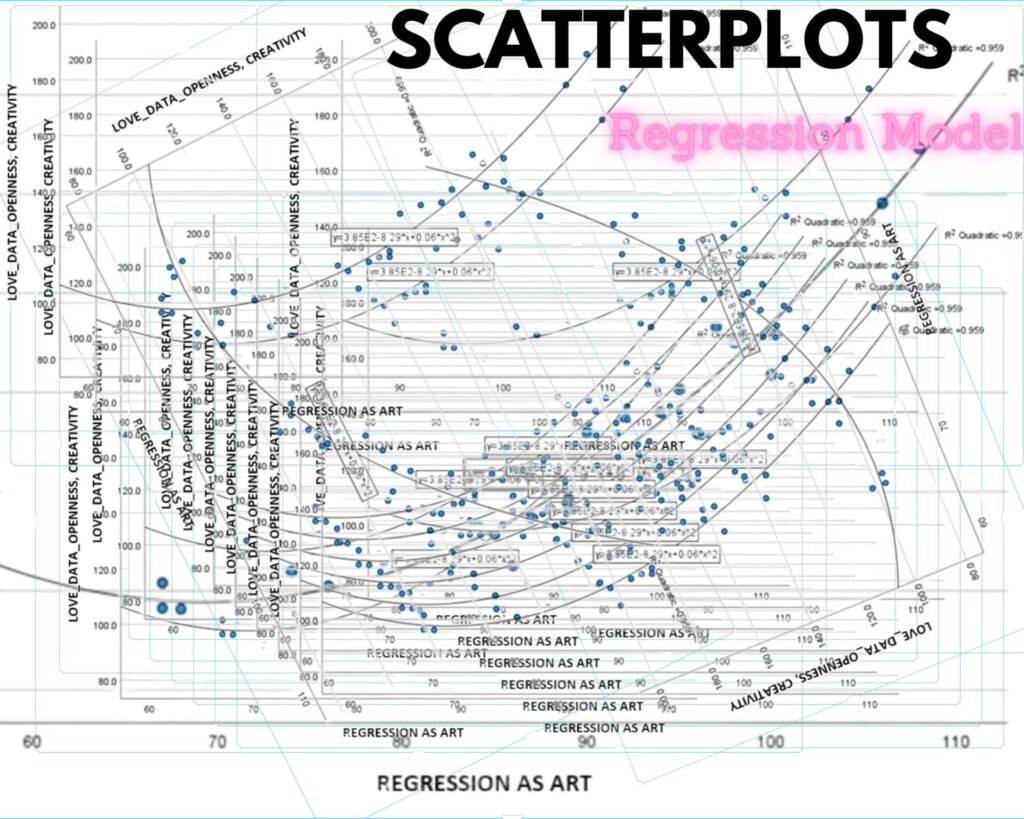
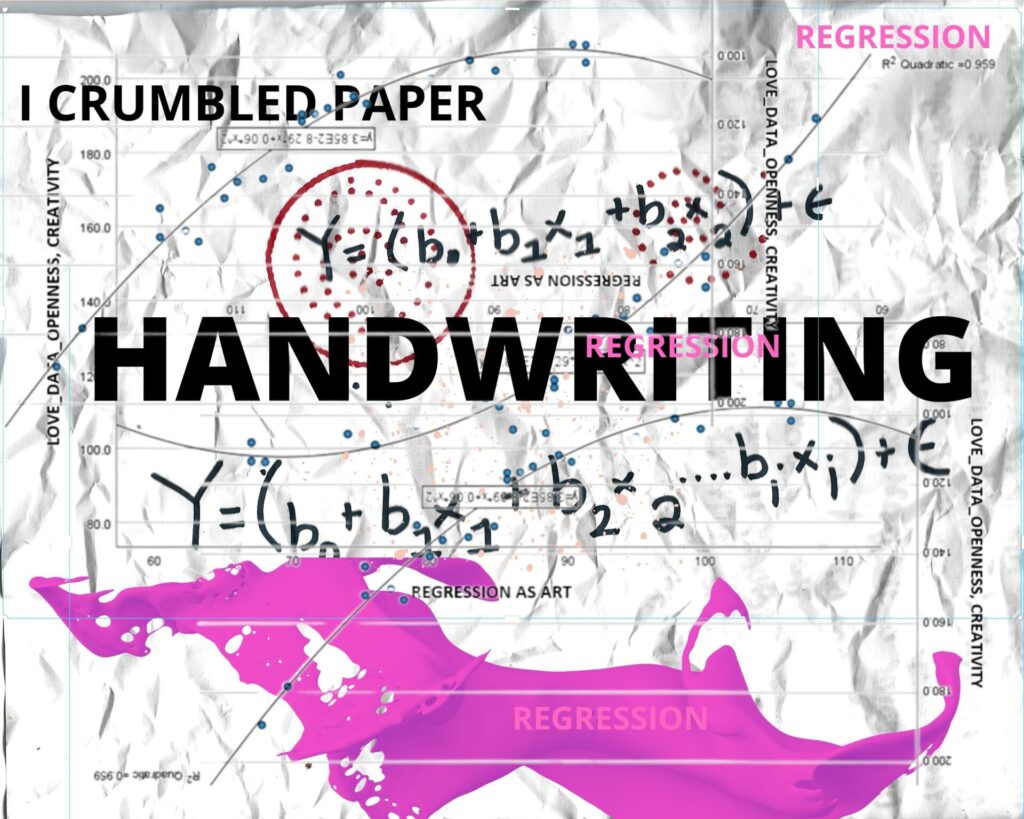
For example, I am always drawn to patterns — or, as an artistic expression, “designs.” There are so many patterns in the data. There are patterns in the histograms, scatterplots, and variants, to name a few. These patterns are often used to visually display the patterning in the numerical values of a single variable. The patterns are indeed the ART and visual pieces of what I see! They move in so many directions that they provide a beautiful collage. How fascinating!!!!! You see, it is here; my senses are heightened as I am drawing possible conclusions!
There is a true distinction between words and depictions of data (Pink, 2011, p. 264). When I am providing an analysis of descriptive statistics, I am essentially describing the data through the methods visually represented through graphs, measures of central tendency, variability, etc. Visually, I can depict a histogram pattern in qualitative measures, such as the shape of the pattern, and quantitative through summary statistics. But, what I see – visually is what probes me to explore/investigate further. This, in turn, heightens my senses. What am I seeing? What is visually represented here? What is the story here? The connection between my ways of knowing influences my sensory processes.
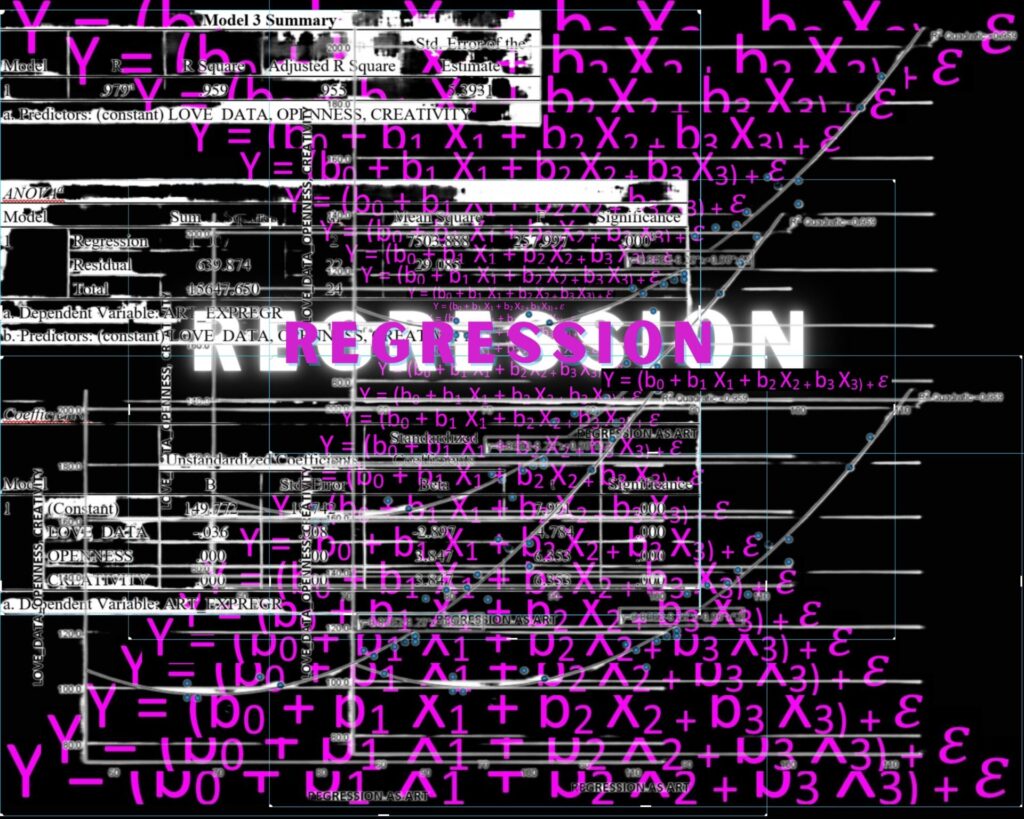
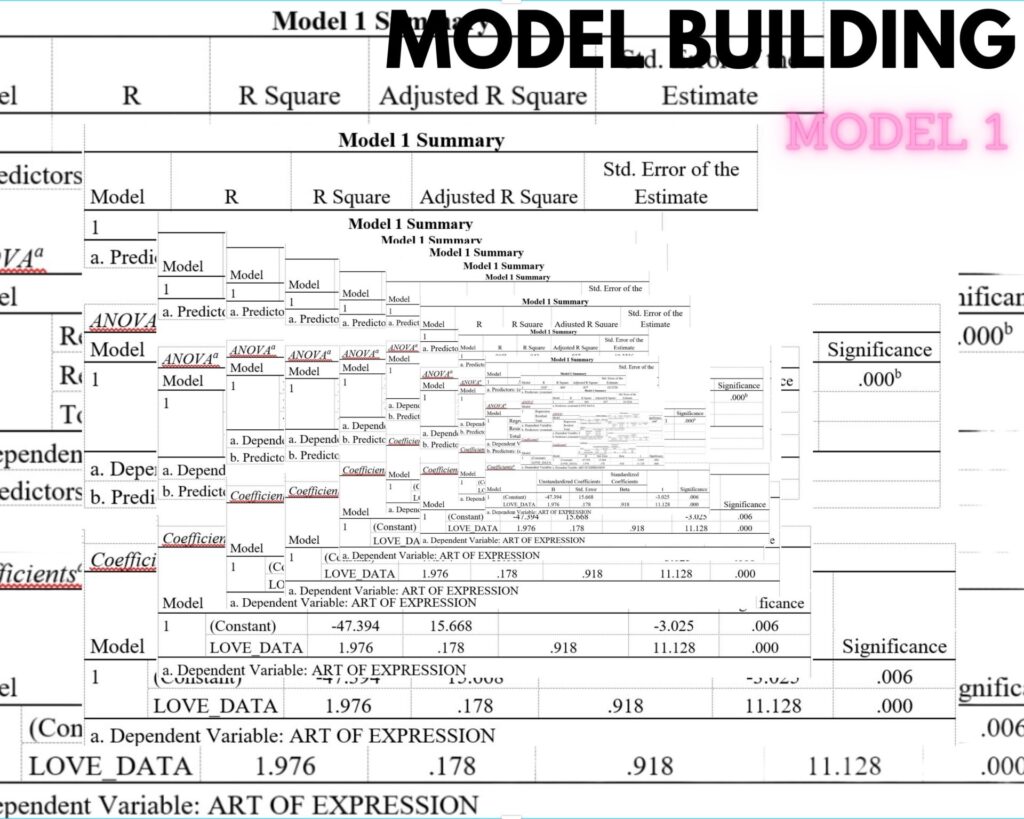
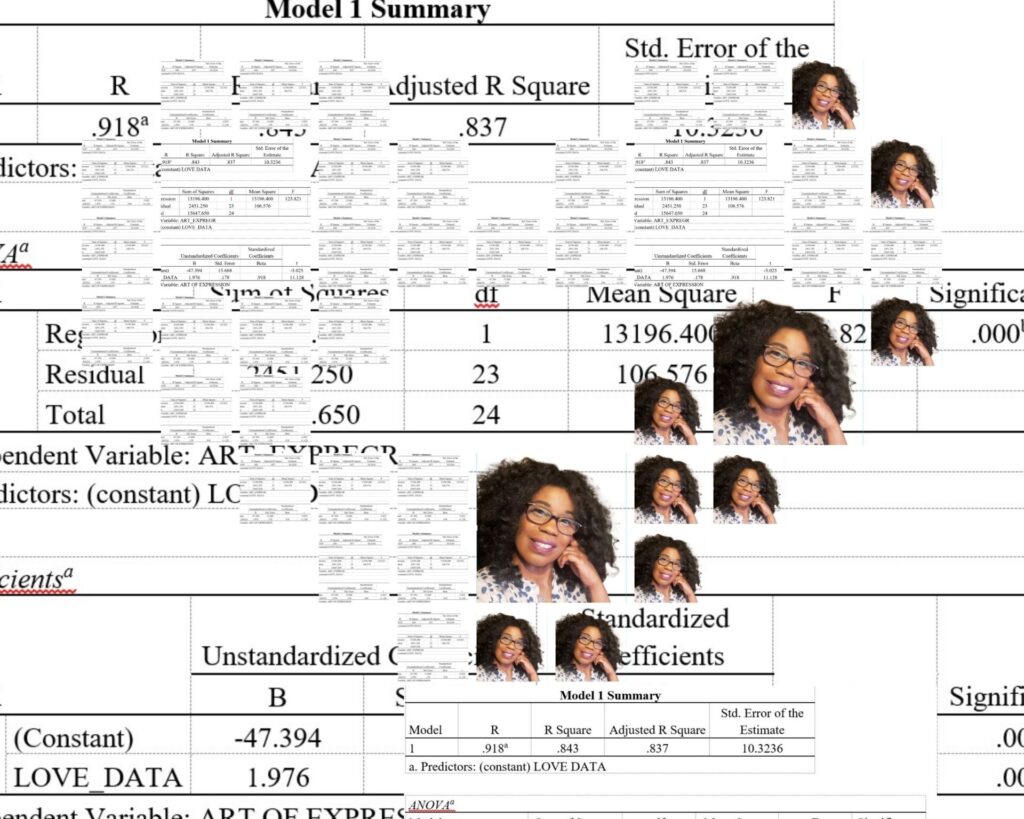
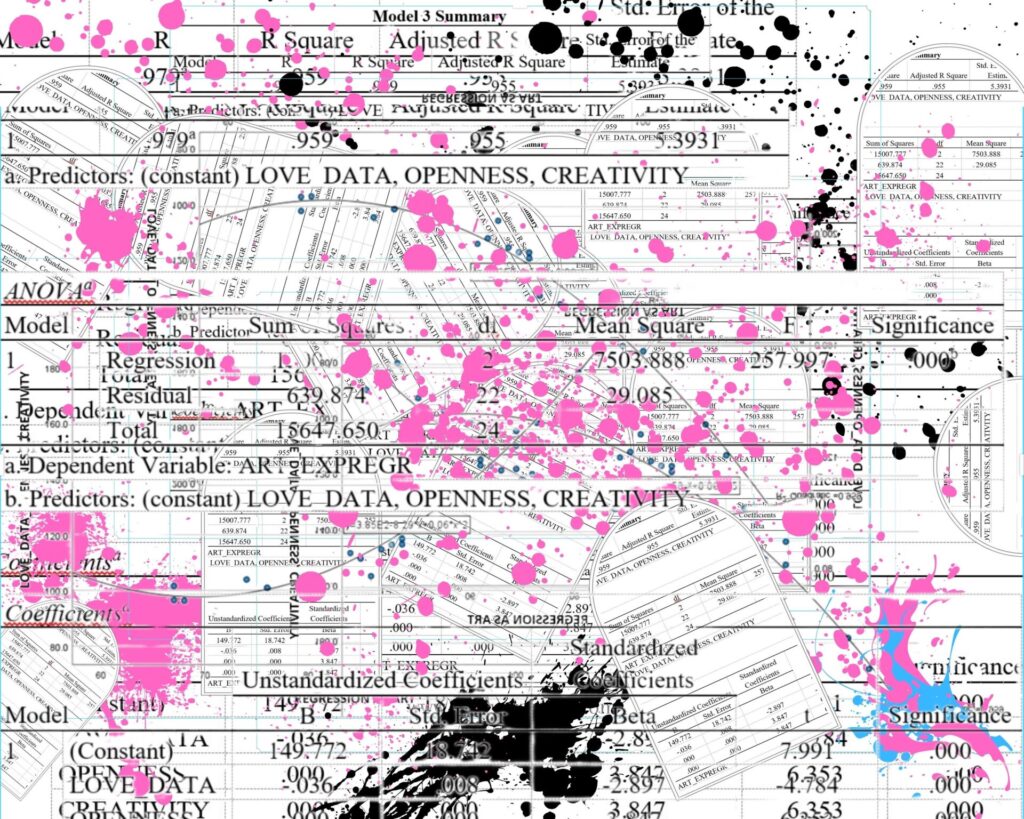
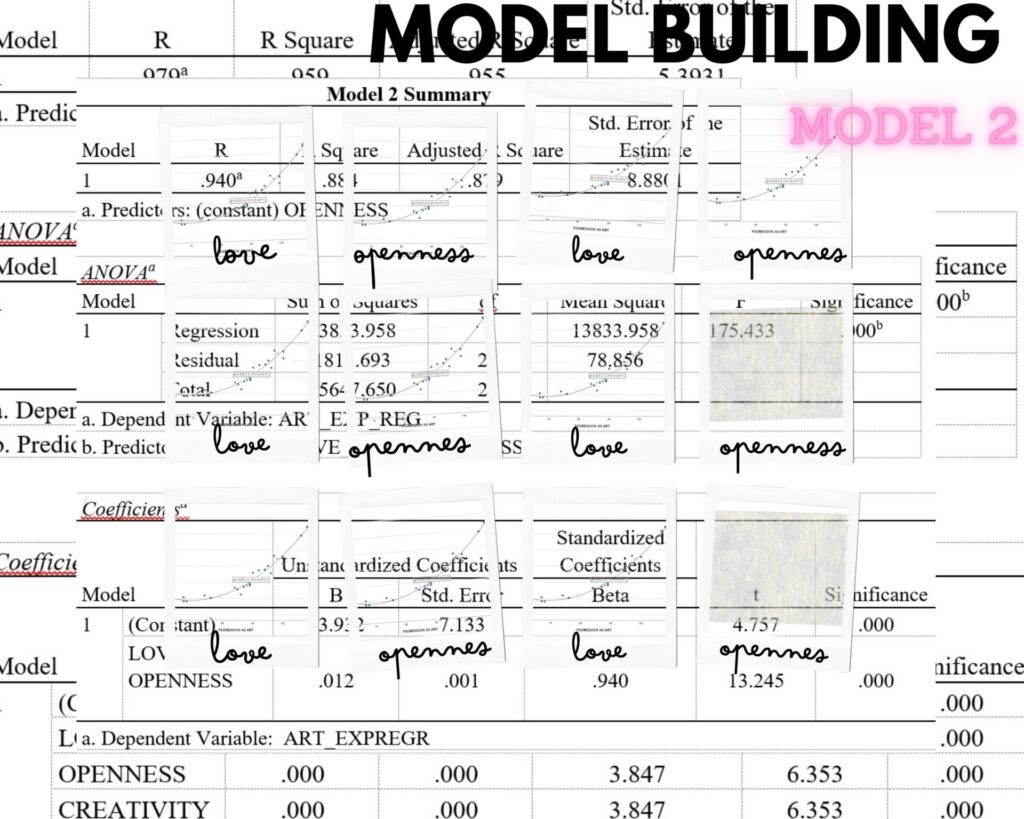
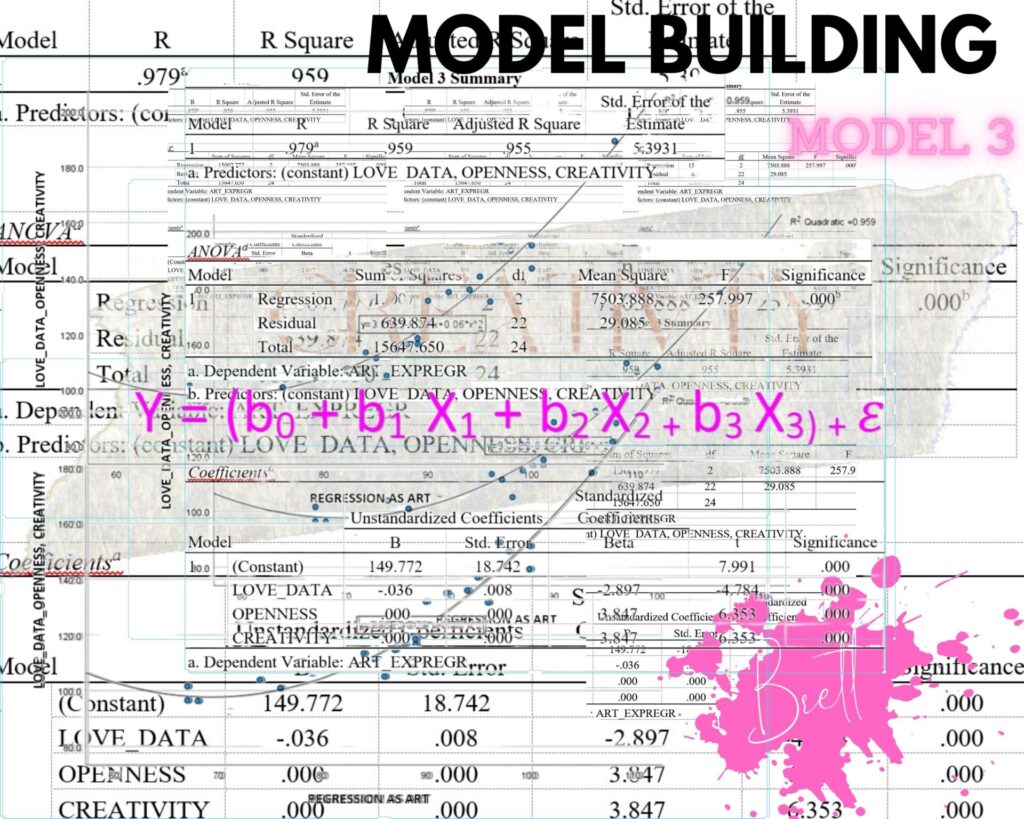
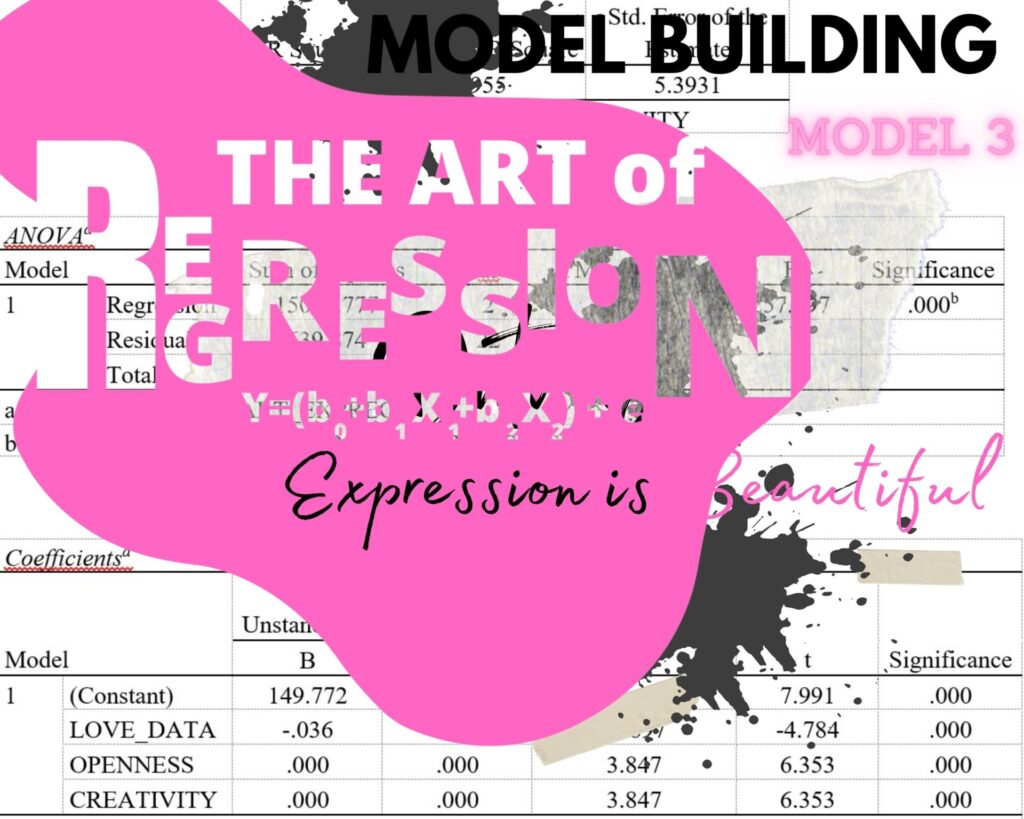
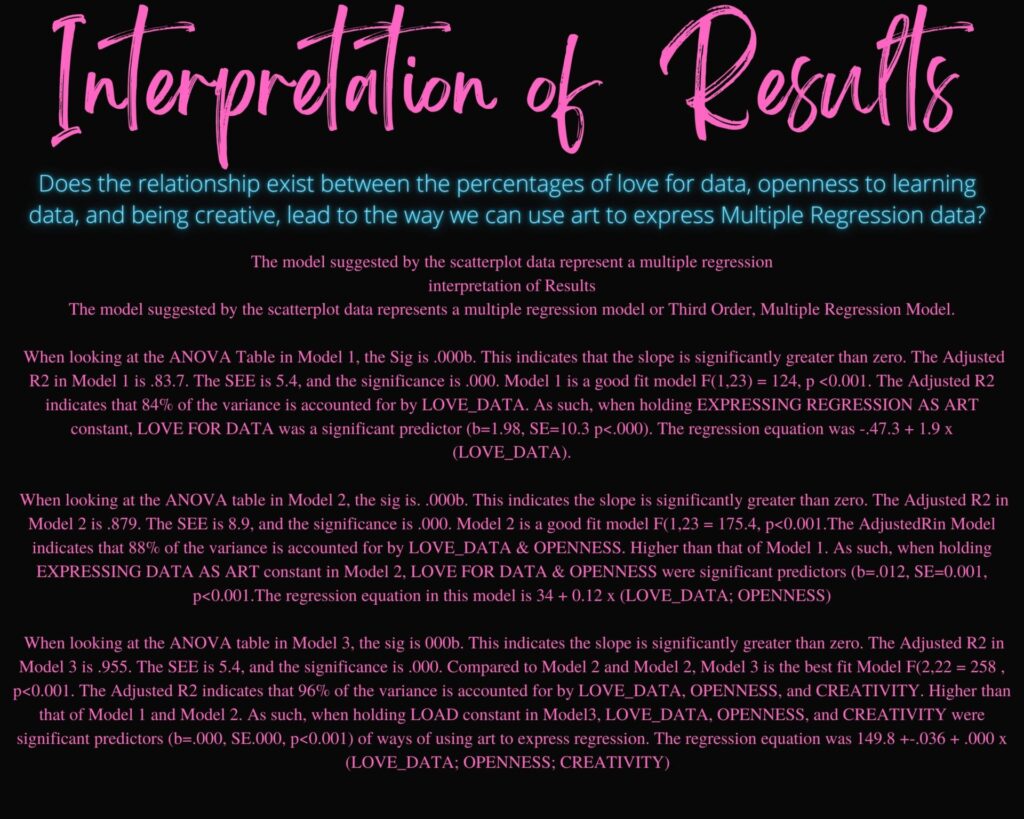
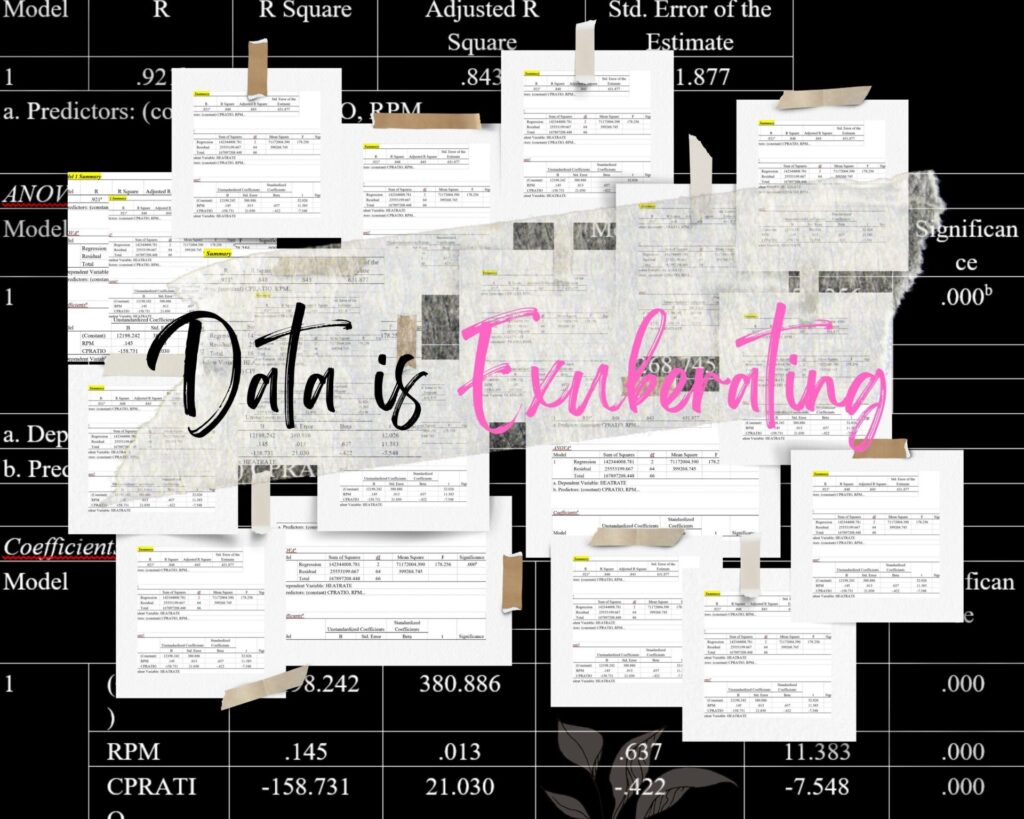
The characteristics of the patterns are how I see the normality of data and the strength and direction of the relationship between variables. I am drawn to the beautiful image and what “design” tells me. The Adjusted R2 and the graph (words and imagery) inform me that this is strong and that the direction is positive and unified! This is storytelling—to me, as I examine the closeness of the dots, and they form within the mean. My observation of the dots tells me there is a uniform consensus that the respondents share something in common. They are sharing, like–minded (in a sense..), and culture within this dynamic.
Though quantitative and qualitative analyses have different languages – their language can be misinterpreted if we are not receptive to learning them. How we can provide artistic meaning when combining both quant and qual methods, we can figure out new elements that can add to a story worth sharing.
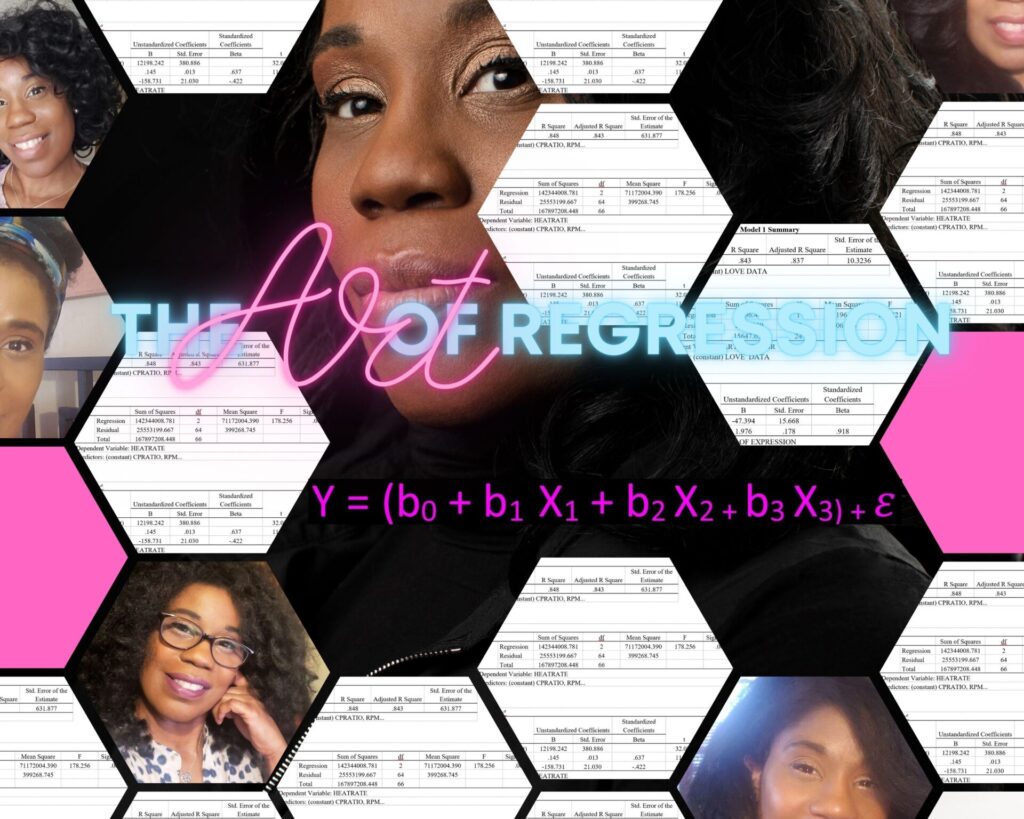
The Art of Regression
